We recently added 3 new formulas to the Add-in for retrieving historical market data:
EPF.Yahoo.Historic1MinuteLookback
EPF.Yahoo.Historic5MinuteLookback
EPF.Yahoo.Historic1HourLookback
These formulas use a “lookback” whereby you can specify the number of periods back from now, together with an option to specify if pre and post market data is included.
Unfortunately, the pre/post market option was not working correctly and this is what has been fixed in this release.
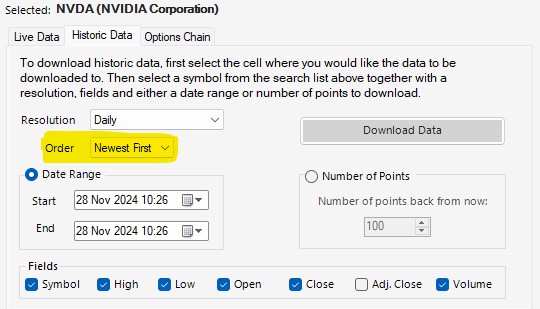
Here is an example of one of these formulas in action:
This dataset is for Apple stock and is hourly data points looking back the past 100 trading hours.
The dates and times shown in column A are in UTC, therefore we can see that pre and post market data is included, also known as “Outside Regular Hours”.
This data is becoming increasingly important as volumes outside normal market hours increase, and our improved historical formulas allow you to easily analyse this data in Excel.
AI is everywhere now; not a day goes by without at least one company releasing an AI related news announcement, the latest being Volkswagen who are integrating ChatGPT into their next generation of cars.
These AI announcements are usually accompanied by a spike in the company’s stock price and this, together with the recent rise in the tech and broader market, has prompted some market commentators to declare that we are in an AI fueled stock market bubble.
Are we in a bubble?
Unfortunately, we will only know if and when the bubble bursts; by its very definition we cannot know if we are in a bubble but let’s crunch some numbers to investigate further.
We’ll use Excel Price Feed to get some financial data into Excel, and we’ll start by looking at the “Magnificent Seven”.
What are the Magnificent Seven? Well, these are the largest, most significant players in the global tech industry, and are leading the charge in bringing AI to the masses:
Apple
Microsoft
Alphabet
Amazon
Nvidia
Meta
Tesla
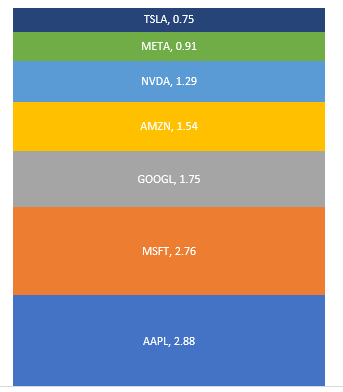
We’ll start with market capitalization, and use the Excel Price Feed formula EPF.Yahoo.MarketCap together with a nice stacked chart to see how they stack up (excuse the pun), units are $trillion:
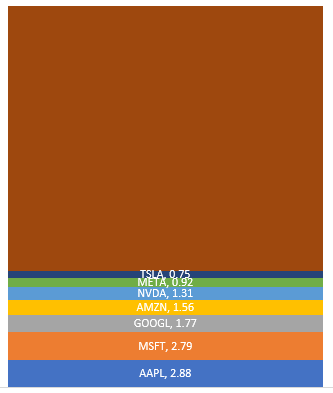
The total market capitalization of these 7 companies is almost $12 trillion, but how does this compare to the market in general, say the S&P500?
Here we have added the rest of the S&P500 ($27 trillion) and can see that the Magnificent Seven account for more than one quarter of the entire market:
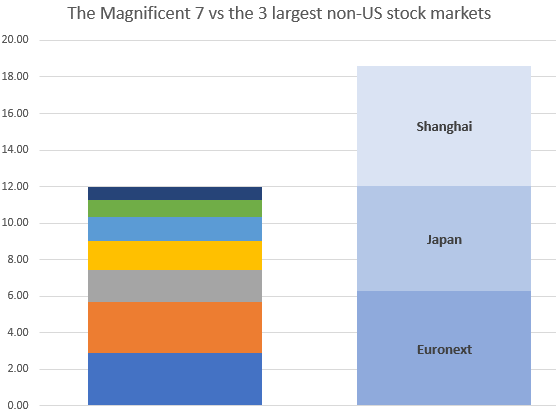
What is even more astounding is how these 7 stack up against entire stock exchanges.
Here we are comparing them with the 3 largest non-US exchanges: Shanghai, Euronext and Japan:
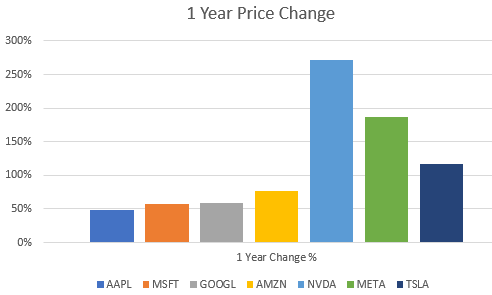
Now let’s see how they have grown over the last 12 months.
We’ll use the EPF.Yahoo.Historic.Close formula to retrieve the stock price at the start of 2023 and compare it to the current stock price using EPF.Yahoo.Price
They’ve all increased by at least 50%, with Nvidia, perhaps the most AI centric stock being the star performer.
So, are we in a bubble?
Why not download Excel Price Feed today and crunch some numbers yourself. You can also download the spreadsheet created for this post from our website to get started.
The US Government, via the US Treasury, offers a wide range of fixed income securities to investors for the purposes of Government funding. These securities are categorised as US Treasury bills, notes or bonds – all are equivalent, the different terminology simply refers to the different maturities. The are often referred to simply as “US Treasuries”:
Treasury Bonds: Mature in either 20 or 30 years
Treasury Notes: Mature between 2 and 10 years
Treasury Bills: Mature from 4 weeks upto one year
The US Treasury Rate (or Yield) is the effective interest rate that the US Government pays on it’s debt. This is the rate that holders of a US Treasury can expect to receive, and as you might expect this rate varies depending on a number of factors.
Some of the many factors, both US and global, that can influence rates are:
How much confidence investors have in the US economy as well as the global economy
Current and expected inflation rates
Current and expected market uncertainty and volatility
The most influential and closely monitored US Treasury is the 10 Year Treasury Note. It is used as a benchmark rate for setting lending rates, in particular for banks to calculate mortgage rates. It is also used as a gauge of investor confidence.
When investor confidence drops, US Treasury rates tend to drop as investors move out of risky assets and into the safe haven of US Government backed securities – and conversely when investors are confident, which usually means stock markets are buoyant then rates will increase to attract reluctant investors back into Treasuries.
Using Excel we can look at current and historical US Treasury rates. The US Treasury makes this data freely available and you can use the Excel Price Feed Add-in formulas to easily get this data into your Excel spreadsheet.
Using the Excel formula below we can retrieve a historical time series (1000 daily data points) of US Treasury yields:
And then plot this data (for the 10 Year Treasury Note) using an Excel chart:
We can see that during 2020, when the world was in the grip of the COVID-19 pandemic, yield/rates dropped dramatically down to around 0.5% as investors moved out of risky assets and US Treasuries became highly sought after. Yields then steadily rose but have dropped back recently as inflation spiked and interest rates rose around the globe to combat it.
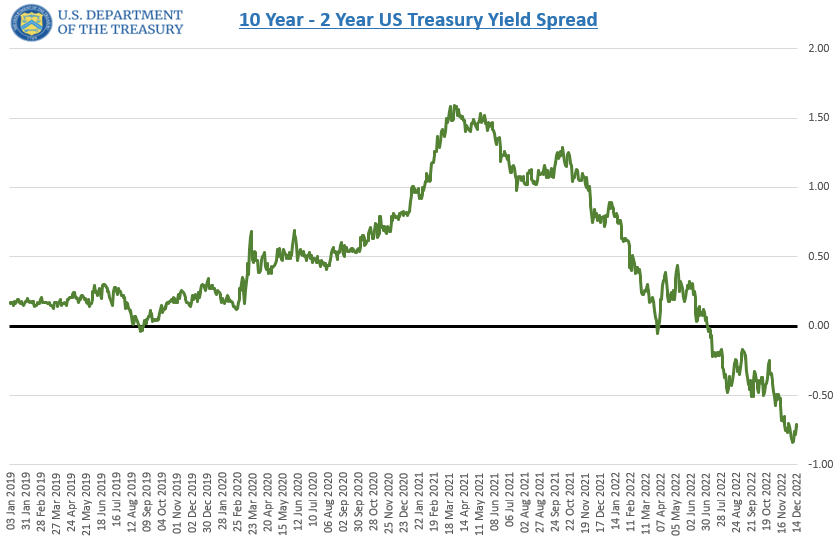
In addition to analysing historical trends of a single US Treasury we can analyse the difference between Treasuries of different maturities, otherwise known as the spread.
Below we can see the 10 Year – 2 Year Spread, perhaps the most common spread used for analysis, and we can see that it is currently “inverted”, i.e. below zero – the 10 Year yield is less than the 2 Year yield. This is often recognised as a leading indicator of a forthcoming recession:
We can use another of the Excel Price Feed formulas, such as the one below:
=EPF.Nasdaq.Last("USTREASURY","YIELD","10 yr")
to retrieve a single data point, the current yield for a single maturity (in this case the 10 Year). Applying a simple data bar visualization in Excel enables us to see how current yields across maturities compare:
We can now clearly see that the 10 year currently has the lowest yield, whereas the 6 month rate has the highest – a spread of over 1%.
I hope this article has given a good overview of what US Treasuries are and how you can use Excel and the Excel Price Feed Add-in formulas to bring US Treasury data into your Excel spreadsheet.
Technical Analysis is used by traders and investors to help identify patterns and trends in historical financial prices. This analysis is often used to produce trading signals or to backtest a trading strategy.
Excel should be a great tool for technical analysis, however traders and investors often struggle with three problems:
Getting historical price and volume data into Excel.
Writing formulas for indicator calculations.
Updating their spreadsheet when new price data is available.
These problems are all solved by using the Excel Technical Analysis Toolkit which has just been released as a new feature of the Excel Price Feed Add-in.
The Toolkit provides a library of new easy-to-use Excel Technical Analysis formulas, so there is no longer a need for complicated Excel formulas or obscure and hard-to-maintain VBA.
Getting historical price and volume data into Excel
Usually, this is achieved by either copying/pasting data from a website/datafeed or downloading a file of prices. With Excel Price Feed you can use one of the many historical data formulas to easily pull prices into your spreadsheet.
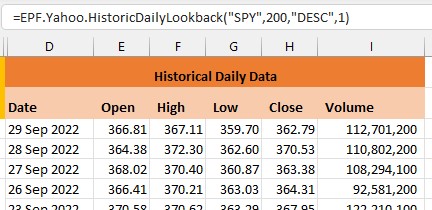
For example, to pull daily historical close prices into Excel for the S&P500 Index, you can use this formula:
Where 200 is the number of days we need, DESC means display the data in DESCending order, so more recent day first, and 1 means show column headings:
Now that we have the historical price data in Excel, we can now perform some Technical Analysis.
Excel Formulas for Technical Analysis
Suppose we want to look at how Bollinger Bands perform for the S&P500 year-to-date using a 20-period lookback with 2 standard deviations.
Without Excel Price Feed, this is how to calculate Bollinger Bands using standard Excel formulas (note that this shows only one third of the steps required):
The first two parameters are simply the close price and date columns of the historical data, and the other two parameters are the number of periods in the lookback and the number of standard deviations.
This is what it looks like in Excel:
Now that the data is in Excel we can easily add an Excel chart to visualize how the bands move with price, and from this we can start to identify support and resistance and potential trend changes:
Updating the spreadsheet when new price data is available
To produce this data we have used two formulas, one for the historical data and one for the technical analysis. When we want to update the data in our spreadsheet, we simply refresh the spreadsheet. This will result in the latest daily close prices being downloaded and the Bollinger Bands being recalculated.
No more copying and pasting data or formulas.
Excel Price Feed has a built in Refresh button as well as automatic refresh functions:
To find out more about Excel Price Feed head over to the website and try it free for 10 days: https://www.excelpricefeed.com/
Today we released a small but very important new feature: a set of new formulas to convert commonly used financial instrument identifiers, such as a CUSIP or ISIN, to a ticker.
This has been a recurring request ever since we launched Excel Price Feed. Often a user is given a spreadsheet with a bunch of ISIN codes and wants to connect those with our live pricing formulas. The problem is that these formulas require a ticker not an ISIN.
What makes this now possible?
FIGI (Financial Instrument Global Identifier)
What is FIGI you may ask?
Well FIGI is an attempt to produce an open standard for financial identifiers, and part of that effort has produced a service that describes the links between different types of codes.
We have now integrated this into our software so conversion formulas are readily available in Excel:
For example, to convert an ISIN (US4592001014) to a ticker (IBM) this simple Excel formula can be used:
=EPF.ID.ISIN.To.Ticker("US4592001014")
And to convert a CUSIP to a ticker, well that is very simple too:
=EPF.ID.CUSIP.To.Ticker("037833100")
To find out more about Excel Price Feed head over to the website and try it free for 10 days: https://www.excelpricefeed.com/
Just a quick blog post today, looking at market performance for a bunch of stocks so far this year (otherwise known as year to date or YTD).
As a reference point, today (24 March 2022) the S&P500 is at -6.2% and the Nasdaq is at -11% for YTD.
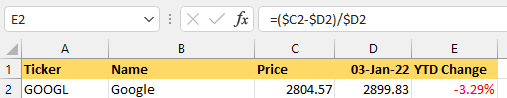
I am using the Excel Price Feed Add-in to download latest price data and start of year prices for a small set of diverse US stocks. I use the live price formula (EPF.Yahoo.Price) in column C together with the historical price formula (EPF.Yahoo.Historic.Close) in column D to retrieve the stock price on the first trading day of the year which was 3rd January.
This produces the following data table (you can see the formula for cell D2 in the formula bar):
Now that we have the current stock price and at the start of the year we can calculate the % change using a simple Excel formula which works out the difference (C2-D2) as a proportion of D2:
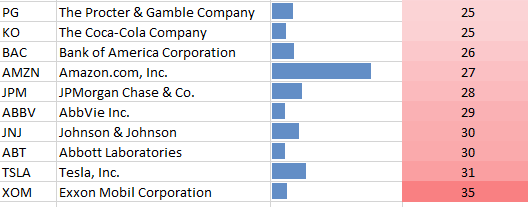
Now we can apply this formula to the rest of the table and create a simple bar chart to visualize the performance:
As we can see the tech sector is under-performing, particularly Facebook and Netflix whilst the oil giants Exxon and Chevron are out-performing everything else.
I hope this gives a good introduction to stock analysis using Excel, to find out more about Excel Price Feed head over to the website and try it free for 10 days: https://www.excelpricefeed.com/
In the world of financial markets most people are aware of stock symbols, the short codes that are used to identify a company. These codes, called symbols or tickers usually reflect the name of the company, for example the symbol for Apple is APPL and the symbol for Microsoft is MSFT.
These symbols represent the tradeable stock or equity in the company.
Other financial instruments have other types of identifiers, for example stock options, which we will discuss in this article.
Stock Option symbols follow a standardised format; for example in the first column below, you can see symbols for 4 different Tesla stock options from the Yahoo Finance website:
The symbol consists of 4 parts:
These parts are:
Stock symbol, eg. TSLA
Expiry Date, eg 3 December 2021, which is written as 211203 (year then month then day)
Option type: P (Put) or C (Call)
Strike Price: eg 1095
The Excel Price Feed Add-in includes a simple Excel formula EPF.OptionTicker which is used to construct an option symbol from its component parts. This is very useful when you wish to analyse lots of options in Excel without having to manually create lots of option symbols.
For example, here is the formula being used to construct the symbol for the option above:
=EPF.OptionTicker("TSLA","Call","3 Dec 2021",1095)
We can see below the formula in action in Excel.
The real power of the forumla, however, is realised when you want to analyse multiple options, which you can combine with the EPF.Yahoo.OptionsChain.ExpiryDates formula (column C below).
Here we are looking at Apple put options with a strike of 160.
We have used the symbol formula in column D and then used the Price/Volume/Open interest formulas for columns E,F,G. This provides a nice visualization of option volume and open interest for a specific strike:
Check out Excel Price Feed today to see how it can help you with your stock option trading.
Excel Price Feed has been built to perform well with large spreadsheets and can handle spreadsheets that contain formulas for many financial instruments and data fields. You can quite easily build an S&P500 stock sheet and analyze a bunch of fundamental or live data points for each stock and not encounter any deterioration in performance.
However, if you start pushing the Add-in or Excel itself towards its “limits” or dont’ think too carefully about the format and design of your spreadsheet you may start to encounter some performance issues.
Here are some tips to help you improve the performance of your spreadsheets. Some of the tips are quite specific to using the Add-in, whilst others are more general and can be used on any type of spreadsheet:
Avoid volatile Excel functions
This issue is the probably the most common reason we see users contacting us regarding spreadsheet performance. Often a spreadsheet will use the Excel function TODAY() which is one of the Excel volatile functions. You should try to avoid using any Excel volatile functions, for a full explanation please see our blog post specifically about Excel volatile functions.
Avoid lots of single historical market data formulas
Often users wish to compare the historical performance of stocks. You can do this using the very useful single historical date formulas. I have seen many spreadsheets which use 100s of these single date formulas to return a time series. A much better alternative is to replace these formulas with a single historical data array formula. These formulas can return a time series of historical data with one formula.
If you don’t need to use all the data in the time series, or want to cross reference trading days/holidays for example, you can use the powerful Excel XLOOKUP function. In this case dedicate one tab on your sheet to time series data and reference this data from your main sheet.
Avoid single large spreadsheets
If you find your spreadsheets becoming unwieldy or suffering from performance issues due to the sheer volume of formulas and data you can look to split your single spreadsheet into multiple spreadsheets. This way you will be dealing with smaller volumes of data on each spreadsheet refresh and are less likely to breach data limits.
Often the data returned by the formulas on your spreadsheet does not change very often or does not change at all, especially if you are looking at fundamental or historical market data rather than live market data.
In this case you can replace your formulas with static values, using the “Paste Values” option in Excel. Select all the cells that you want to set to static, copy them to the clipboard, then “paste values” back into your spreadsheet. Using this method you can initially populate your spreadsheet using formulas, and then replace those formulas with static values/text.
This will greatly reduce the number of formulas on your spreadsheet and improve performance.
Summary
I hope these tips help you improve the performance of your spreadsheets. If you have any more tips please leave a comment below.
Interest in ethical and sustainable issues has exploded over recent years and today we can see these issues start to influence those in the financial investment community. Investors are increasingly taking into account non-financial factors in their portfolio selection, including the impact a company has on the environment and society.
This shift was compounded yesterday as US President Biden issued an executive order requiring development of a comprehensive government-wide climate risk strategy. This strategy will influence how and where the US Government directs it’s annual $680 billion budget for goods and services. It also sets in motion plans to revise the Trump-era rules that required pension fund managers to put their members financial interests ahead of climate change and other environmental issues when allocating funds for investments.
The winners in this process will be those companies and suppliers that score highly on environmental and sustainable measures.
ESG (Environment, Social and Governance) Ratings
But how do investors identify and select investments based on non-financial measures such as environmental impact?
This is where ESG (Environment, Social and Governance) Ratings come in. These ratings provide a numerical value which scores how ethical or sustainable a company is. One of the market leaders in providing ESG Risk Ratings is Sustainalytics, a Morningstar company.
They provide Risk Ratings, for many companies, which are scored on a scale from 0 to 40+, with low numbers representing a low risk and high numbers indicating a high risk/impact:
Building the Portfolio
We’ll start with the S&P500 and just look at the top 30 largest companies. We want to rank these companies based on their ESG ratings and for this we can use the ESG Excel formulas provided by the Excel Price Feed Add-in.
Here is the top 5 stocks in the S&P500, we have added formulas for Market Capitalization and ESG Total Score:
This is a good start but we can improve it considerably by using some of the Excel data visualization tools. For example, we can add a “Heat Map” effect to the ESG Risk Score, this will enable us to quickly see which stocks have a high or low score. We can also add a “Data Bar” to the Market Cap column so we can easily compare the size of the company.
We can also use the Excel Data-Sort function to sort our list by ESG Risk Score, this gives us the following for the top 10 stocks:
And for the bottom 10:
It was not a surprise that Exxon at the bottom, but I was surprised to see so many pharmaceutical companies represented in the bottom 10.
We can refine our data further by not only comparing the stocks against each other but against their peers. For example, a company might have a relatively good score compared to the general market but not perform well against its peers, i.e. companies operating in the same industry/sector.
I’ve added a further two columns, one showing the risk score for its peers, and another showing the difference compared to its peers. I have also used a “Data Bar” to highlight the difference: a red bar (negative) indicates a score lower than its peers (a good thing) whereas a blue bar indicates a higher score.
Here is the a full ESG analysis of the top 30 stocks in the S&P500:
Hopefully this gives you some ideas on how you can go about building your own ethical portfolio.
Visit the Excel Price Feed website to download the Add-in to provide all the Excel formulas used to build the spreadsheet shown above.