IG client sentiment is an indicator that IG Index provides to show what percentage of clients have long or short positions.
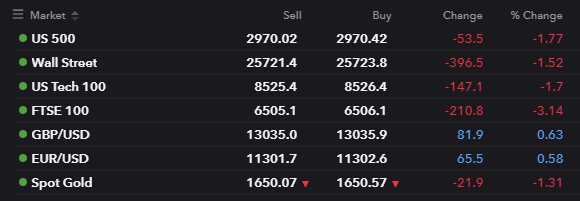
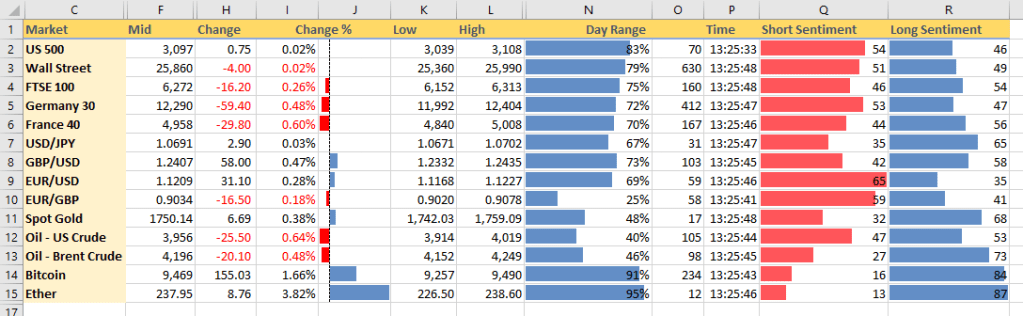
For example looking at the NASDAQ index, we can currently see that 56% of clients are long this market and 44% are short:

A general consensus is that this is often a “contrarian” indicator, clients try to short when the market when it is going up and go long when the market is going down.
The Excel Price Feed Add-in provides historical client sentiment data which you can download into Excel. You can then combine this data with historical market data to see how client sentiment changes as the market changes.
Here is a chart of long client sentiment (the orange line) versus market daily close (the blue line) for the S&P500 Index over the past 4 months:

There does appear to be a correlation, as the market moves up client long positions moves down – clients are moving from long to short positions as the market goes up.
Then at the peak (early September) client positions were long just before the market started dropping.
As the market moved down (i.e. for the past month) clients stayed long.
This example shows that client sentiment data can be used to provide trading signals, especially at “turning points” in sentiment. Obviously this would need to be tested against different markets but it is definitely a useful tool when looking for trading opportunities.