How to Get the Last Trading Day of Each Month in Excel

The problem with month-end dates

If you want to create a table of historical month-end prices in Excel, there is a small problem you need to deal with: the last day of a month isn’t always a trading day.

For example, 31 May 2025 was a Saturday, so there was no closing price for the S&P 500 on that date. Similarly, month-end dates can fall on Sundays or exchange holidays.

Let’s say we want to create a table showing the month-end levels for three major indices:

  • S&P 500 (^GSPC)
  • NASDAQ Composite (^IXIC)
  • FTSE 100 (^FTSE)

We could use the EPF.Yahoo.Historic.Close formula to retrieve the closing price:

=EPF.Yahoo.Historic.Close("^GSPC",A3)

This works when the date in A3 is a trading day. However, if the date is a Saturday, Sunday or exchange holiday, there is no closing price for that date and the formula returns an error:
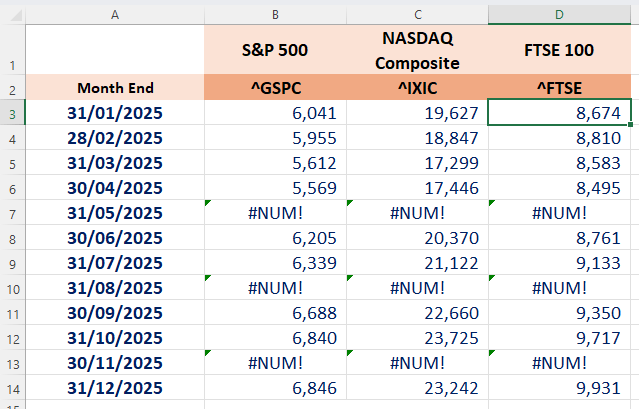
Formula =EPF.Yahoo.Historic.Close("^GSPC",A3) showing an error for a month-end date that falls on a non-trading day

In this article, we’ll show you how to automatically find the last available trading day’s closing price for each month, without having to manually enter the actual last trading date of each month.

Using historical data to find the last trading day

One option would be to use Excel’s WORKDAY function to move backwards from the month-end date.

The problem is that WORKDAY knows about weekends, but it doesn’t automatically know about every exchange-specific holiday.

A better approach is to ask Excel Price Feed for a small range of daily historical data ending on the month-end date, and then simply take the final available trading day.

For example for May 2025, we can do this using:

=EPF.Yahoo.HistoricDatePeriod("^GSPC","Daily",A7-14,A7,"ASC",0)

This retrieves the daily historical data from 14 calendar days before the month-end through to the month-end.

The result contains several columns of historical data:
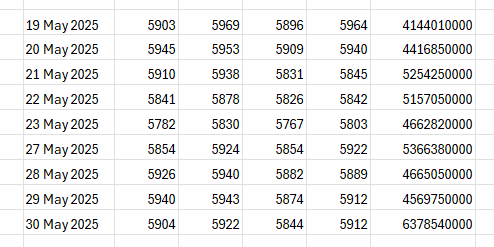
The HistoricDatePeriod formula entered in Excel, with the resulting Date, Open, High, Low, Close and Volume data spilling into the worksheet

Because we have requested the data in ascending order, the final row will contain the most recent trading day in our date range, in this case the 30th May 2025.

That is exactly what we need.

Why use a 14-day range?

You might wonder why we’re using:

A3-14

rather than simply looking at the previous few days.

The reason is that we’re working with calendar days, not trading days. A month-end can fall immediately after a weekend or a holiday period, so giving the formula a reasonable buffer makes sure there is a trading day available in the requested range.

Fourteen calendar days is normally plenty for ordinary weekends and holiday combinations. If you’re working with a market that has an unusually long closure, you can increase the buffer.

The important part is that the end date remains the month-end date, so the final row returned by HistoricDatePeriod is the last available trading day on or before that date.

Extracting the closing price

We don’t need all of the historical data in our final table. We only want the Close value from the final trading day.

Excel’s INDEX function can be used to extract the fifth column, which is the Close column:

=INDEX(data,,5)

We can then use Excel’s TAKE function to return the final value from that column:

=TAKE(closes,-1)

Rather than putting these into separate formulas, we can combine them using Excel’s LET function.

The final formula

Assuming:

  • The ticker is in row 2
  • The month-end date is in column A
  • The first ticker is in B3
  • The first month-end date is in A3

the formula is:

=LET(
data,EPF.Yahoo.HistoricDatePeriod(B$2,"Daily",$A3-14,$A3,"ASC",0),
closes,INDEX(data,,5),
TAKE(closes,-1)
)

One of the advantages of this formula is that you don’t need to change it for every index or every month.

The ticker reference is:

B$2

and the date reference is:

$A3

This means we can simply copy the formula across the columns and down the rows. The finished spreadsheet will look something like this:
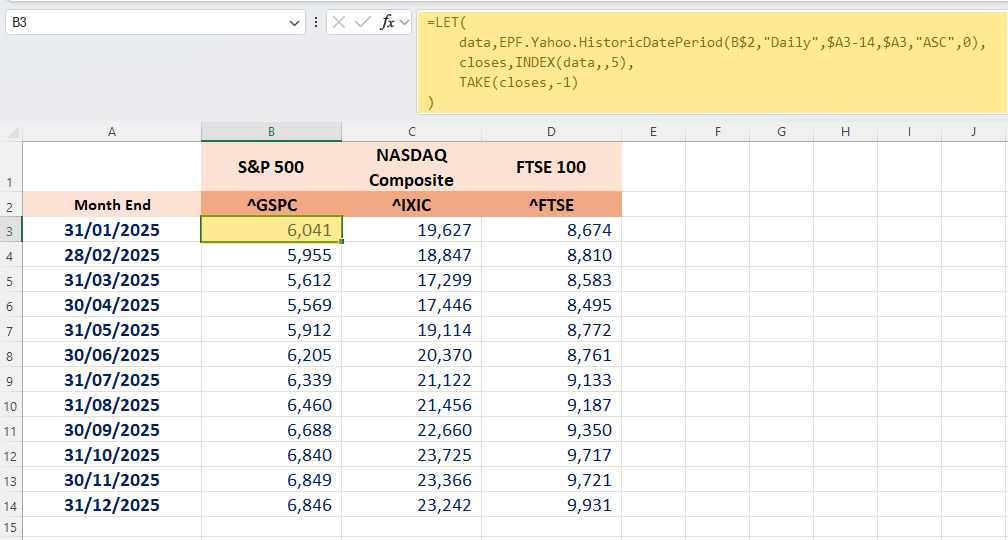
The final formula entered in B3, with the resulting closing price displayed

This formula does three things:

  1. Retrieves daily historical data for the ticker in B2, covering the 14 calendar days leading up to the date in A3.
  2. Extracts the Close column from the historical data.
  3. Returns the final close in the data set — which is the last available trading day on or before the month-end.

Notice that the dates in column A are still the calendar month-end dates. The formula automatically finds the last trading day when the month-end itself isn’t a trading day. For example, if the month ends on a Saturday, the formula will return Friday’s closing price.

This approach avoids maintaining a list of exchange holidays and means your spreadsheet continues to work automatically when you add more months or more indices.

Bonus Tip: Automatically generating the month-end dates

You don’t have to type all the month-end dates manually either.

If A3 contains:

31/01/2025

you can use:

=EOMONTH(A3,1)

in A4 and copy the formula down.

This will generate the subsequent month-end dates automatically:
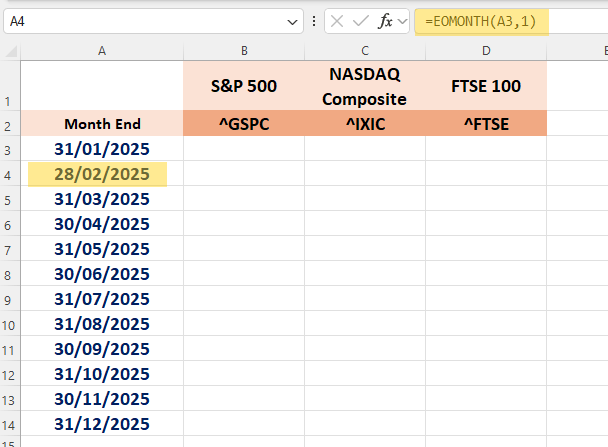
Column A showing the EOMONTH formula being copied down to generate all 12 month-end dates

We hope you find this useful!

Chart Crime and Bubbles

There are lies, damned lies and statistics. There are also charts that are published to mislead or to simply reinforce a point of view that’s flimsy at best or just plain wrong.

These charts are known as “chart crimes” and one appeared all over social media last month. Usually I would just make a comment and move on but this one received over 2 million views and deserves further investigation.

It was a chart comparing the growth of the Nasdaq over two periods: the dot com bubble and the current AI “bubble”. The conclusion being that we are on the same upward trajectory and all things being equal are due a major crash anytime soon.

Here is the chart and tweet in question:

AI Boom vs. Dot Com Bubble.

Aside from the obvious lack of timescale on the x axis and disparity in y axis scaling, does this chart bear any resemblance to reality?

Let’s build our own using Excel Price Feed to retrieve historical market data and produce an Excel chart based on the actual data.

For the Dot com bubble period we will use 1996 to 2002 and for present day we will look at data from Q4 2022 (when ChatGPT was released) to now.

To retrieve the data we will use the Excel Price Feed HistoricDatePeriod formula. Here is an example of how to retrieve monthly data for the NASDAQ Composite Index:

=EPF.Yahoo.HistoricDatePeriod("^IXIC","MONTHLY","1 Sep 2022","1 Oct 2025","ASC",1)

We will base each time series to 1 so we are comparing like-for-like. To do this we simply divide each point by the initial starting point.

We can now plot this data in Excel; the blue line is the dot com bubble, and the orange line is the past 3 years:

Compare Nasdaq dotcom bubble vs AI bubble

Not nearly as dramatic, the trajectory is similar but we are barely halfway towards the dot-com crash equivalent peak. So if the past is an indicator of the future then we should expect the market to double again from here and crash in about a year. But as they say, the past is not always a predictor of the future…

What about individual stocks?

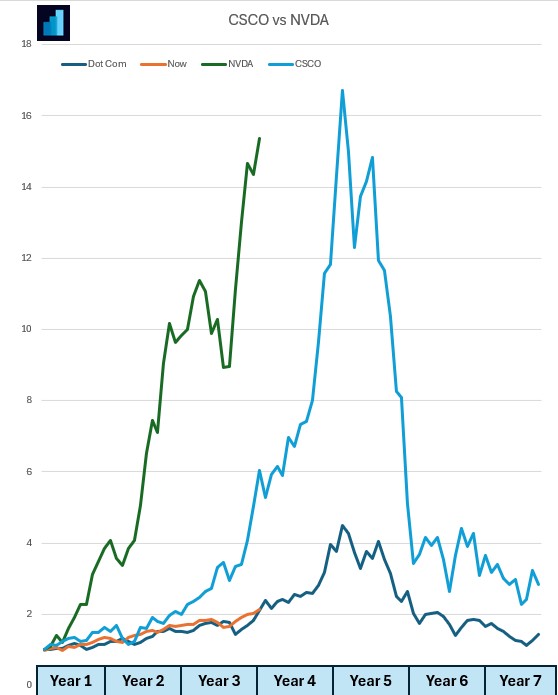
Let’s look at one from the dot com bubble: Cisco (light blue) and one from now: Nvidia (green).

Nvidia has climbed at a much steeper rate than Cisco. Again, similar trajectory and timescales:

Compare CSCO dot com bubble with NVDA stock now

If you want to build financial charts like this yourself check out Excel Price Feed today and try it free for 10 days: https://www.excelpricefeed.com/

Excel Price Feed Add-in Release (v1.139)

Today we released a new version of Excel Price Feed. To update your Add-in, please follow the instructions in the User Guide.

In this release, we plugged in any gaps in formulas which were missing the Quarterly and Trailing 12 Months equivalent. The gaps were in the Balance Sheet, Income Statement and Cash Flow groups of formulas.

You can see these formulas in use in our example Yahoo Finance spreadsheet.

Yahoo Finance: Income Statement formulas

We added the following Quarterly formulas, which take as input a stock ticker and reporting quarter:

  • EPF.Yahoo.QuarterlyImpairmentOfCapitalAssets
  • EPF.Yahoo.QuarterlyOtherSpecialIncomeCharges
  • EPF.Yahoo.QuarterlyRestructuringAndMergersAcquisition
  • EPF.Yahoo.QuarterlySpecialIncomeCharges
  • EPF.Yahoo.QuarterlyWriteOff

And the following Trailing 12 Month (TTM) Formulas, which take as input just a stock ticker:

  • EPF.Yahoo.TTMImpairmentOfCapitalAssets
  • EPF.Yahoo.TTMOtherSpecialIncomeCharges
  • EPF.Yahoo.TTMRestructuringAndMergersAcquisition
  • EPF.Yahoo.TTMSpecialIncomeCharges
  • EPF.Yahoo.TTMWriteOff

Here is an example of the new formulas used in a sheet. This dataset is for the NWL ticker.

And here are a couple of examples of formulas we used:

=EPF.Yahoo.QuarterlyImpairmentOfCapitalAssets("NWL",0)/1000
=EPF.Yahoo.TTMImpairmentOfCapitalAssets("NWL")/1000

Please bear in mind when using these formulas that not every company reports the same type of information so sometimes the formulas might return #NUM!

For more details please see the Excel Formula Reference: Income Statement section in the User Guide.

Yahoo Finance: Balance Sheet formulas

We also added some additional formulas for retrieving Quarterly figures, which all take as inputs a stock ticker and a quarter. Yahoo doesn’t make available equivalent TTM formulas.

  • EPF.Yahoo.QuarterlyAccountsPayable
  • EPF.Yahoo.QuarterlyAccountsReceivable
  • EPF.Yahoo.QuarterlyAssetsTotalCash
  • EPF.Yahoo.QuarterlyCapitalLeaseObligations
  • EPF.Yahoo.QuarterlyCurrentAssets
  • EPF.Yahoo.QuarterlyCurrentLiabilities
  • EPF.Yahoo.QuarterlyGoodwill
  • EPF.Yahoo.QuarterlyGoodwillAndOtherIntangibleAssets
  • EPF.Yahoo.QuarterlyInventory
  • EPF.Yahoo.QuarterlyInvestedCapital
  • EPF.Yahoo.QuarterlyLongTermDebt
  • EPF.Yahoo.QuarterlyNetDebt
  • EPF.Yahoo.QuarterlyNetPropertyPlantEquipment
  • EPF.Yahoo.QuarterlyRetainedEarnings
  • EPF.Yahoo.QuarterlyStockholdersEquity
  • EPF.Yahoo.QuarterlyTangibleBookValue
  • EPF.Yahoo.QuarterlyTotalAssets
  • EPF.Yahoo.QuarterlyTotalDebt
  • EPF.Yahoo.QuarterlyTotalLiabilities
  • EPF.Yahoo.QuarterlyTotalNonCurrentAssets
  • EPF.Yahoo.QuarterlyTotalNonCurrentLiabilities
  • EPF.Yahoo.QuarterlyWorkingCapital

Here is an example of these new formulas in action:

And here are some examples of the new formulas we used:

=EPF.Yahoo.QuarterlyAccountsPayable("NWL",0)/1000
=EPF.Yahoo.QuarterlyAccountsReceivable("NWL",0)/1000

For more details please see the Excel Formula Reference: Balance Sheet section in the User Guide.

Yahoo Finance: Cash Flow formulas

Lastly, we added quite a few additional Quarterly and TTM formulas for Cash Flow. Along with the formulas for Free Cash flow (added in the previous version) below are all the Cash Flow formulas in the system.

Quarterly formulas:

  • EPF.Yahoo.QuarterlyAccountsPayableChange
  • EPF.Yahoo.QuarterlyAccountsReceivableChange
  • EPF.Yahoo.QuarterlyAcquisitions
  • EPF.Yahoo.QuarterlyBeginningCashPosition
  • EPF.Yahoo.QuarterlyCapitalExpenditures
  • EPF.Yahoo.QuarterlyChangeInCash
  • EPF.Yahoo.QuarterlyChangeInWorkingCapital
  • EPF.Yahoo.QuarterlyCommonStockIssued
  • EPF.Yahoo.QuarterlyCommonStockRepurchased
  • EPF.Yahoo.QuarterlyDebtRepayment
  • EPF.Yahoo.QuarterlyDeferredIncomeTax
  • EPF.Yahoo.QuarterlyDepreciationAndAmortization
  • EPF.Yahoo.QuarterlyDividendsPaid
  • EPF.Yahoo.QuarterlyEndCashPosition
  • EPF.Yahoo.QuarterlyFreeCashFlow
  • EPF.Yahoo.QuarterlyInventoryChange
  • EPF.Yahoo.QuarterlyOtherCashflowsFromInvestingActivities
  • EPF.Yahoo.QuarterlyOtherFinancingActivities
  • EPF.Yahoo.QuarterlyOtherNonCashItems
  • EPF.Yahoo.QuarterlyPurchasesOfInvestments
  • EPF.Yahoo.QuarterlySalesOfInvestments
  • EPF.Yahoo.QuarterlyStockBasedCompensation
  • EPF.Yahoo.QuarterlyTotalCashflowsFromFinancingActivities
  • EPF.Yahoo.QuarterlyTotalCashflowsFromInvestingActivities
  • EPF.Yahoo.QuarterlyTotalCashflowsFromOperatingActivities

Trailing 12 Month (TTM) formulas:

  • EPF.Yahoo.TTMAccountsPayableChange
  • EPF.Yahoo.TTMAccountsReceivableChange
  • EPF.Yahoo.TTMAcquisitions
  • EPF.Yahoo.TTMBeginningCashPosition
  • EPF.Yahoo.TTMCapitalExpenditures
  • EPF.Yahoo.TTMChangeInCash
  • EPF.Yahoo.TTMChangeInWorkingCapital
  • EPF.Yahoo.TTMCommonStockIssued
  • EPF.Yahoo.TTMCommonStockRepurchased
  • EPF.Yahoo.TTMDebtRepayment
  • EPF.Yahoo.TTMDeferredIncomeTax
  • EPF.Yahoo.TTMDepreciationAndAmortization
  • EPF.Yahoo.TTMDividendsPaid
  • EPF.Yahoo.TTMEndCashPosition
  • EPF.Yahoo.TTMFreeCashFlow
  • EPF.Yahoo.TTMInventoryChange
  • EPF.Yahoo.TTMOtherCashflowsFromInvestingActivities
  • EPF.Yahoo.TTMOtherFinancingActivities
  • EPF.Yahoo.TTMOtherNonCashItems
  • EPF.Yahoo.TTMPurchasesOfInvestments
  • EPF.Yahoo.TTMSalesOfInvestments
  • EPF.Yahoo.TTMStockBasedCompensation
  • EPF.Yahoo.TTMTotalCashflowsFromFinancingActivities
  • EPF.Yahoo.TTMTotalCashflowsFromInvestingActivities
  • EPF.Yahoo.TTMTotalCashflowsFromOperatingActivities

Here is an example of the new formulas used in a sheet. This dataset is for the MSFT ticker.

Again the Quarterly formulas take a input a ticker and a reporting quarter and the Trailing 12 Month (TTM) Formulas take as input just a stock ticker. Examples:

=EPF.Yahoo.QuarterlyDividendsPaid("MSFT",0)/1000
=EPF.Yahoo.TTMDividendsPaid("MSFT")/1000

Please download our example Yahoo Finance spreadsheet to find examples of using these formulas.

We hope you find them useful. Let us know if there are any more formulas you would like us to add.